












Performance Through Independence

Unlocking Incremental App Growth Beyond Google and Meta

Report by
In collaboration with

Key Insights

Consumer app marketers over-index budgets on walled gardens

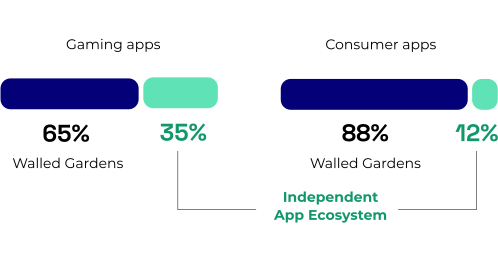
As consumer app revenue surged 25% in 2024, 88% of marketing spend is still concentrated in the walled gardens such as Google and Meta.

Incremental performance awaits beyond Google and Meta

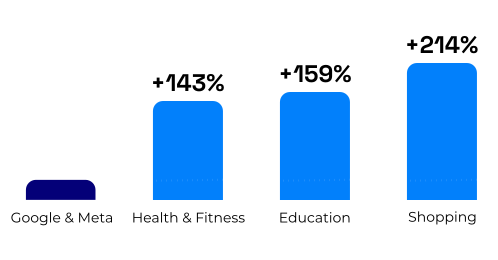
D30 ROAS improved by as much as 214% for consumer app marketers who diversified their media mix to include channels outside Google and Meta.

User attention is shifting beyond social and entertainment apps

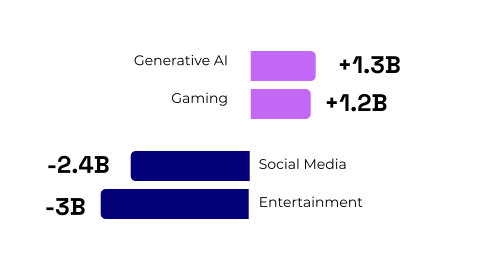
Time spent on social and entertainment apps is slowing, while gaming, productivity, and generative AI apps are accelerating.

 Independent apps reach as many users as TikTok & Instagram

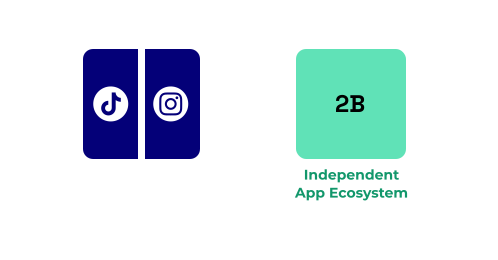
With over two billion DAU, the Independent App Ecosystem delivers the same level of reach and user engagement as TikTok and Instagram combined.

Diverse inventory is key to driving performance

High-value users are scattered across thousands of apps, making broad reach essential for maximizing every conversion opportunity.

Consumer App Revenue Is Growing, but Budgets Remain Concentrated in Google and Meta

Consumer apps—defined in this report as all mobile app categories outside of gaming, such as entertainment, finance, and delivery and food—experienced significant global revenue growth in 2024, with in-app purchase (IAP) and subscription revenues rising 25% to reach $70.5 billion. This growth trajectory is accelerating, and for the first time, consumer app revenue is projected to surpass gaming revenue within the next two years.

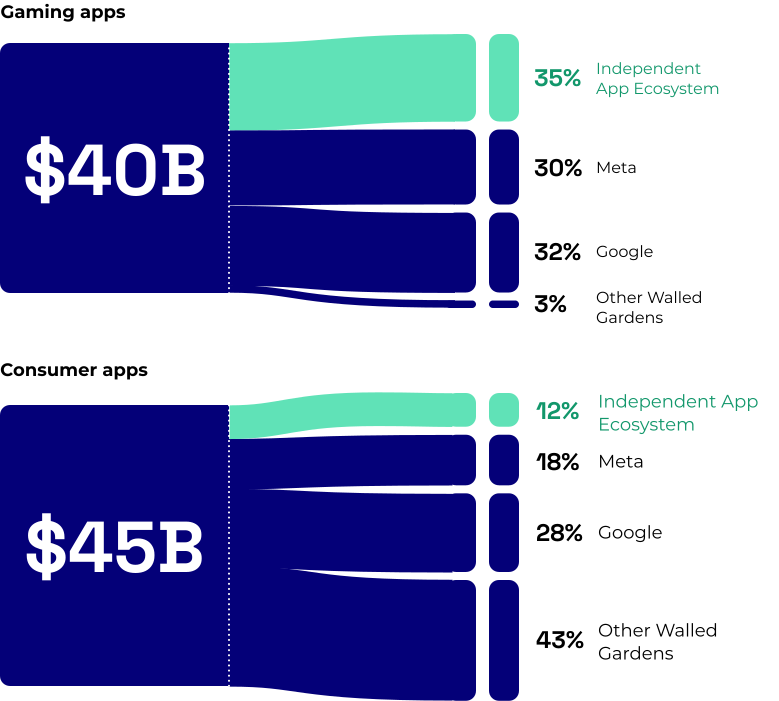
Despite this momentum, consumer app marketing budgets remain disproportionately concentrated on just two platforms: Google and Meta. In 2024, walled gardens (Google, Meta, and others) captured 88% of the $45 billion consumer mobile app advertising market—an imbalance that does not accurately reflect where users are actually spending their time.*

In collaboration with Sensor Tower and Singular, this report highlights the substantial growth opportunities available to consumer app marketers within the Independent App Ecosystem. Through detailed analyses of the incremental lift from marketing channel diversification, insights into app user behavior, and an understanding of how users convert within mobile apps, the findings demonstrate the opportunity for marketers to diversify beyond walled gardens to uncover new areas of growth for incremental and scalable performance.

*Source: Moloco internal estimates | 2024

Consumer app revenue is set to overtake gaming for the first time

Line chart: Yearly IAP and subscription revenue for consumer apps and gaming apps | 2014-2024
Bar chart: YoY IAP and subscription revenue growth by consumer app category | 2023-2024

Select country

Thank you! Your submission has been received!
Oops! Something went wrong while submitting the form.

App category

Gaming
Consumer

VIZ 1 GOES HERE

Source: Sensor Tower | 2014-2024

Marketers Are Leaving Money on the Table by Overlooking the Independent App Ecosystem

The Independent App Ecosystem—an ecosystem of millions of diverse mobile apps that are developed, published, and monetized by independent companies rather than by the major technology giants—represents a substantial yet underutilized opportunity for consumer app marketers. While gaming marketers have recognized this potential, directing around 35% of their advertising budgets to independent apps, consumer app marketers have been slower to adopt.

Consumer app marketers allocate just 12% of their ad spend outside of the major walled gardens. This is further underscored by a 2025 Moloco/Marketing Dive study, which found nearly 50% of consumer app marketers have never explored advertising beyond Google and Meta.

This gap highlights a critical disconnect: Many consumer app marketers have yet to align their budgets with the diverse ways users actually engage across the broader app landscape.

Consumer app marketers lag in embracing the Independent App Ecosystem

Estimated global mobile app ad spend for consumer apps and gaming apps by channel | 2024
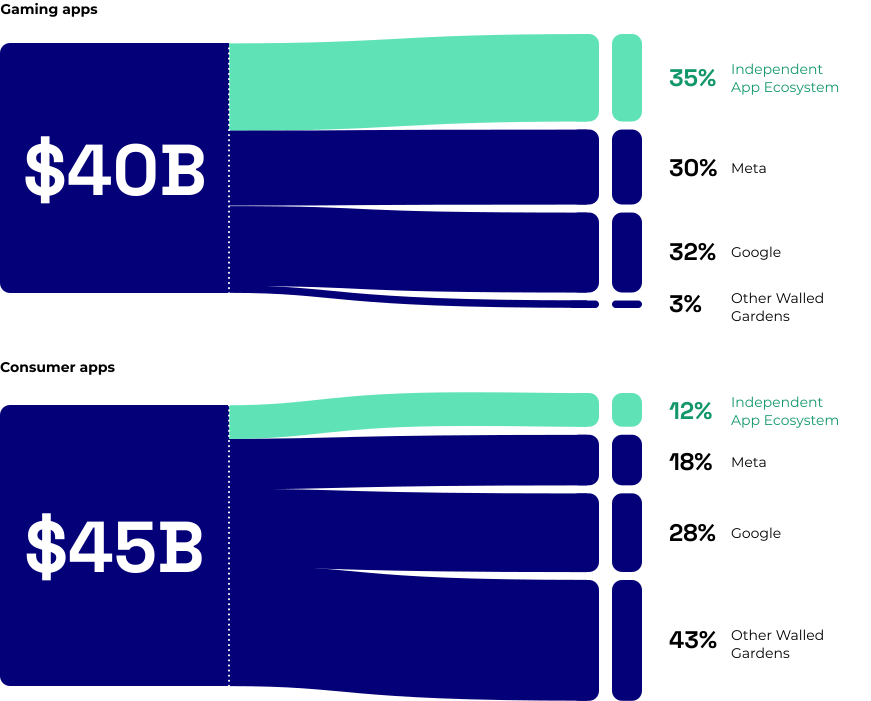
Flow chart for gaming and consumer apps
Source: Moloco estimates of user acquisition spend by channel | 2024
Note: Other Walled Gardens: Apple (Apple Ads), TikTok, X, Snapchat, Reddit, and OEM app stores

Diversifying spend to the Independent App Ecosystem significantly improves D30 ROAS

In collaboration with Singular, a meta-analysis was conducted across Singular’s client base to examine how return on ad spend (ROAS) is impacted by focusing the majority of advertising spend on Google and Meta versus diversifying budgets across both major platforms and the Independent App Ecosystem. The results clearly demonstrate the advantage of diversification: All gaming and consumer marketers who expanded beyond Google and Meta saw an average increase of 48% in Day 30 ROAS.

For consumer app marketers, the average increase was even higher, reaching 116%. Among the categories with statistically significant data, consumer app marketers in shopping, education, and health and fitness saw some of the strongest performance, with average Day 30 ROAS improving up to 214%.

The analysis at a glance

2K+

apps

$5B+

ad spend

Apps included in the study were divided into two groups:
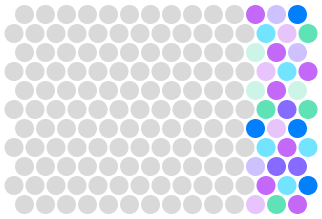
Majority of spend on Google and Meta (80%+)
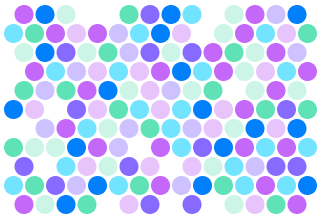
Diversified spend (<80% on Google and Meta)

We’ve consistently seen that consumer app marketers who move beyond the walled gardens unlock stronger ad performance. Our meta-analysis backs that up with hard data: a Day 30 ROAS lift of up to 214%. It’s a clear signal that consumer app growth is accelerating in the Independent App Ecosystem. That’s where sustainable, measurable scale is coming from.
Stephanie Pilon, CMO

Consumer marketers see significant ROAS gains with a diversified strategy

D30 ROAS lift of apps that diversify spend to the Independent App Ecosystem | 2025

VIZ 4 COMBINED

Source: Singular meta-analysis of over 2,000 gaming and consumer apps | 2025

Brands such as Nestlé Purina and Turo are already capitalizing on these benefits, achieving incremental performance gains by diversifying their media strategy to include the Independent App Ecosystem alongside established platforms.

Self-attributed performance from your partners can get you into a sticky spot as a performance marketer, as it doesn't allow you to see the full picture of what could be causing incremental lift across the full user journey. That can come at an expense to a brand because it might prevent diversifying into channels that may actually be more cost-effective or incremental.

Diana Gilbert, Marketing Manager-Performance and Personalization
Since expanding our channels beyond social partners, we’ve seen an increase in platform bookings that we have been able to validate through incrementality modeling. We’re excited to push performance further by increasing our creative velocity.

Valerie Castro, Acquisition Marketing Director

User Behavior Has Changed, but Most Media Strategies Haven’t

Consumer app marketers can only fully unlock growth potential when their advertising strategies align with real user behavior, reaching them directly in the diverse range of apps where they actively spend their time and attention. Understanding these usage patterns is essential to driving meaningful engagement and scalable ROI.

In-app time spent has peaked in mature markets, but keeps rising in emerging ones

Mobile apps continue to be the primary channel for digital engagement, yet growth patterns vary significantly across markets. In developed regions such as the U.S., the U.K., Germany, and Japan, mobile app usage has reached high levels of saturation, leading to a notable slowdown in growth rates. In contrast, time spent surged in emerging markets such as South Africa, India, and the Philippines, driven by continued smartphone penetration and expanding digital access.

For marketers, this means future growth won’t come simply from increased app usage. Instead, sustainable growth will require engaging users in new and diverse ways, meeting them within the many apps where they already spend their time outside of traditional walled gardens.

Growth in mobile app time spent is slowing in developed regions but accelerating in emerging markets

Total hours spent on mobile apps and compound annual growth rate by country | 2021-2024

Select region

Thank you! Your submission has been received!
Oops! Something went wrong while submitting the form.

Year

2021
2024

Growth

Vis6 Growth Legend Placeholder

VIZ 6 GOES HERE

Source: Sensor Tower | 2021-2024
Note: Top 10 mobile app markets are defined by countries with the highest total IAP and subscription revenue

User attention is shifting from social and entertainment to more diverse app categories

A closer look at user behavior across different app categories reveals a notable shift. User attention is becoming increasingly fragmented, particularly in developed markets, with audiences moving away from traditional social media and entertainment apps towards a broader range of apps such as casual gaming, productivity tools, and emerging categories such as generative AI.

Deeper emotional and psychological factors are driving the change in how users spend their time on traditional social platforms. According to a recent Moloco/YouGov survey, 53% of app users say they want to spend less time on social media. That number climbs even higher among younger audiences, with 63% of 18-24 year olds and 65% of 25-34 year olds expressing a desire to cut back. The reason? Emotional fatigue. In fact, 42% of 18-24 year olds report feeling negative emotions—such as envy, anxiety, distrust, or being overwhelmed—when using social platforms like Facebook or TikTok.

As mobile user attention continues to spread across a wider range of app categories, it's become more important than ever to understand where and how users are spending their time. There are clear shifts in user behavior, with app engagement plateauing in mature markets while rising steadily in emerging markets. For marketers, this means they need to capture attention on the diverse apps where users spend their time.
Seema Shah, VP of Insights

These sentiments offer a compelling signal that today’s users are actively reevaluating their digital habits, seeking more purposeful and multifaceted experiences across a broader range of apps. Many users also report a growing sense of not only emotional fatigue but ad fatigue, with 66% of respondents saying they feel like they see the same ads repeatedly on social media apps.

Time spent in social and entertainment apps is declining, especially in developed markets

YoY change in total hours spent on mobile app categories | 2023-2024

Select country

Thank you! Your submission has been received!
Oops! Something went wrong while submitting the form.

VIZ 7 GOES HERE

Source: Sensor Tower | 2023-2024

Each generation has distinct app preferences marketers can’t ignore

Time spent in apps varies significantly by age group and category. Younger users (18-24) gravitate towards games, education, and graphic design apps, while adults aged 25-44 are more active in business, finance, and delivery and food apps. Meanwhile, users over 45 typically spend more time in medical, weather, and news apps, as well as in puzzle, word, and social casino games.

This means that there is no one-size-fits-all channel for reaching diverse mobile users. Success requires accessing a wide array of apps to connect with users in their preferred digital environments.

Demographics shape where users spend their time

Time spent vs. general population of app categories by age group | 2025

Select country

Thank you! Your submission has been received!
Oops! Something went wrong while submitting the form.

Time spent vs. general population

Less time
More time
Hover for more
Tap for more

VIZ 8 GOES HERE

Source: Sensor Tower | 2025

The Independent App Ecosystem reaches as many users as TikTok and Instagram combined

Users are scattered across millions of specialized apps that cater to specific interests, activities, and daily routines. This fragmentation means that relying solely on walled gardens limits a brand’s potential reach and engagement. Through the Independent App Ecosystem, marketers can engage with their ideal users wherever they spend their time by accessing more than three million of these specialized apps that reach more than two billion daily active users (DAU)—comparable to TikTok and Instagram combined. ⓘ  

At M+C Saatchi Performance, we actively guide clients to expand beyond the walled gardens not just to lower acquisition costs, but to unlock fresh growth by tapping into new digital moments. Successful growth strategies follow user behavior. Ad spend should reflect where consumers actually engage, rather than being limited by legacy media habits.
Megan Price,
Director, Programmatic Strategy and Planning

The Independent App Ecosystem captures significant mobile attention

Daily active users (DAU) vs. total hours spent in mobile apps | 2024-2025

Select country

Thank you! Your submission has been received!
Oops! Something went wrong while submitting the form.
Hover for more
Tap for more

VIZ 9 GOES HERE

Source: Moloco DAU reach | 2025; Sensor Tower hours spent in mobile apps and DAUs of other walled gardens | 2024

The Independent App Ecosystem captures attention in every app category

User behavior and engagement patterns differ significantly across app categories such as finance, education, travel, health, utilities, and beyond. This diversity is also evident across different countries, where app engagement trends reflect distinct local preferences and behaviors. The Independent App Ecosystem effectively captures this varied user attention, reaching users wherever they choose to spend their time.

There are notable differences in app usage and growth patterns across regions

YoY growth in mobile app time spent and share of total mobile app time spent | 2023-2024

Select up to 3 countries to compare

Select up to 2 countries to compare

Thank you! Your submission has been received!
Oops! Something went wrong while submitting the form.

Time spent in-app (% of total)

Hover for more
Tap for more

VIZ 10 GOES HERE

Source: Sensor Tower | 2023-2024

The Independent App Ecosystem Is Where Mobile Advertising Performance Happens

Given that user attention is now spread across diverse apps, marketers face an increasingly fragmented landscape. Each user is unique in the apps they engage with, as different apps serve distinct purposes and address specific moment-to-moment needs.

This behavioral diversity is particularly evident within the Independent App Ecosystem. Here, app usage isn't confined to predictable patterns or specific app categories. Instead, app usage reflects who the users are, what tasks they’re trying to accomplish, and the specific times of day they turn to different apps. To achieve real results, marketers need to access diverse publisher inventory to reach their ideal users precisely when and where they're most receptive.

High-value users act with more variety and frequency than most marketers realize

Today’s high-value users interact with a diverse range of apps. For each app category, there are power users who have their unique fingerprint across seemingly unrelated apps.

E-commerce app users in the U.S., for example, over-index on time spent in casino games and news apps compared to the general population. This pattern perhaps reveals how shopping enthusiasts fill waiting moments with quick entertainment while staying current on trends and events that may shape their buying decisions.

Finance app users exhibit their own equally diverse profiles. For example, finance users in Japan spend significantly more time on travel and sports apps than the average user. These finance users may be planning their next business trip in a travel app while engaging with sports content during market downtime.

This diversity explains why limiting campaigns to “relevant” categories leaves money on the table. The Independent App Ecosystem captures these complex user journeys, turning every app into a potential conversion point.

Distinct and unexpected app usage patterns emerge by persona

How to read this chart for each persona: The first row shows the number of apps used in a month and ad opportunities encountered, which are defined as unique bid requests on the Moloco Ads platform. The second row shows the 3 highest categories in time spent difference vs. the general population and example global apps for those categories. The last row shows the distribution by gender and age group.

Select country

Thank you! Your submission has been received!
Oops! Something went wrong while submitting the form.

Select app user persona

VIZ 11 GOES HERE

Source: Moloco analysis of independent apps used, ad opportunities, and example ad-supported apps | 2025; Sensor Tower analysis for demographic and time spent | 2025

The power of context in reaching ready-to-act users

To maximize ROI, targeting the right users is just the beginning. Marketers also need to consider timing and context. Different users rely on different apps depending on the time of day, and each app session presents a distinct emotional or functional context. For example, finance apps are often checked in the morning for market updates, while sports apps see a traffic spike in the evening when games are live or scores are updated. These moments influence how receptive users are to certain types of ads—and how likely they are to take action.

This matters because advertising within diverse inventory enables marketers to connect with users during leaned-in, high-attention moments. It also highlights how the Independent App Ecosystem offers marketers more contextual flexibility compared to walled gardens, which often follow consistent, less dynamic patterns of use.

Users turn to different apps based on time of day

App usage by time of day based on ad opportunities | 2025

Select country

Thank you! Your submission has been received!
Oops! Something went wrong while submitting the form.

Select categories to compare to social

Thank you! Your submission has been received!
Oops! Something went wrong while submitting the form.

VIZ 12 GOES HERE

Source: Moloco internal analysis of ad opportunities by category and time of day | 2025
If marketers aren’t evolving their strategies to meet users in new environments, they’re not just missing reach—they’re missing relevance. This is why it is so important for us to have our ad strategies reflect where users actually spend their time.
Greg Rossi, Senior Director, Integrated Marketing

High-value users convert from unexpected places

New app users can come from surprising places. A finance app's next high-value user might convert from a gaming, weather, or recipe app, not just from other finance apps. This is the hidden power of the Independent App Ecosystem: conversions happen across every category, often in unexpected places.

Traditional marketing logic suggests targeting similar apps—finance apps advertising in other finance apps, and shopping apps targeting other shopping apps. But conversion data reveals a different pattern. Delivery and food marketers acquire paying customers from utility apps. Travel app marketers get conversions from productivity apps. Shopping app marketers find buyers in gaming environments.

This happens because users are multidimensional. Delivery and food users check weather apps before deciding to venture out or order in. Travel bookers juggle spreadsheets and flight searches simultaneously. Shoppers play casual games during lunch breaks. Each of these touchpoints represents a conversion opportunity.

The data is clear: Campaigns limited to “relevant” categories miss potential customers in the hundreds of other apps where they spend time. The Independent App Ecosystem provides access to all these touchpoints, multiplying opportunities to reach ready-to-buy users wherever they may be. Success comes from embracing this diversity rather than fighting it.

Diverse inventory is key to maximizing performance

Indexed cost per payer (CPP) by publisher inventory. Higher number equals cheaper relative CPP for each advertiser category | 2025

Select publisher inventory category

Hover for more
Tap for more

VIZ 13 GOES HERE

Source: Moloco Internal Performance Data | 2025

Unlocking the Opportunity of the Independent App Ecosystem With Moloco

Given today’s fragmented mobile landscape, marketers can no longer rely solely on traditional walled gardens to effectively engage consumers. Users now leverage an increasingly diverse array of mobile apps, making it essential for marketers to evolve their strategies to reach users wherever they are.

This is exactly why Moloco Ads was built—to help app marketers drive incremental performance on the Independent App Ecosystem:

AI-Powered Performance

Based on an app’s first-party data, Moloco automatically finds, acquires, and re-engages high-value users wherever they spend their time on the Independent App Ecosystem.

Using Moloco’s AI-powered platform, we activated our first-party data to acquire and re-engage high-value users across independent apps—boosting engagement, increasing DAU by 7%, and driving incremental growth beyond walled gardens.
Kyungsang Cho, NNT CEO

Single Buying Door

Through a single access point, Moloco simplifies media buying by offering access to over three million independent apps that reach more than two billion DAU.

Moloco has transformed our performance marketing through one powerful platform. We've driven high-quality bookings and strong user engagement in an extremely competitive travel market.
Varun Bagai, Associate Director

High-Quality, Brand-Safe Placements

Moloco Ads maintains strict quality standards aligned with Google and Apple's app store requirements. We use real-time monitoring and exclusion lists to continuously improve inventory quality. These efforts have earned TAG and IAB Gold certifications.

Moloco helped us protect our players and uphold brand safety by delivering high-quality impressions within trusted, app store-approved environments.
Blair Hilton, Director, Performance Marketing

Industry-Leading Transparency

Moloco Ads gives clear visibility into where ads run, which creatives, placements, and publishers drive performance, and how every marketing dollar is being utilized.

With Moloco, the level of reporting granularity—whether it’s top-performing creatives or publisher-level insights—gives us exactly what we need to test and scale with confidence. We’ve been able to identify which creative formats and placements drive the most conversions and long-term retention.
Ara Salbashian, Head of Digital Marketing

What matters to marketers is real-world proof of the Independent App Ecosystem’s incremental impact. Here, Mistplay shares how they validated Moloco’s unique ability to drive incremental results beyond their Google and Meta campaigns by reaching users across a broader range of apps.

Ready to diversify your media mix and capture incremental growth on the Independent App Ecosystem? Contact us to get started.

Methodology

This report is based on data from Moloco, Sensor Tower, and Singular, with all sources cited contextually throughout the report.

Countries covered: Australia, Brazil, Canada, France, Germany, India, Indonesia, Japan, Mexico, South Korea, the United Kingdom, the United States, and Vietnam.

Analysis window: January-December 2024 (unless noted otherwise).

Key data inputs:

  • Moloco’s internal forecasts on global mobile user acquisition spend across channels.
  • Singular’s meta-analysis of over $5 billion in ad spend and 2,000 gaming and consumer apps, comparing spend on mostly Google and Meta vs. diversified spend across both major platforms and the Independent App Ecosystem.
  • Sensor Tower’s Mobile App Insights and Audiences Insights for country-level and audience-level time spent insights and leading ad platform DAU trends.
  • Moloco/Marketing Dive survey (December 2024-January 2025; n=200 US mobile app marketers) tracking campaign goals, channel satisfaction, and adoption of programmatic media.
  • Moloco/YouGov survey (June 2025; n=3,000 mobile users in the U.S., the U.K., and India) tracking app usage and sentiment.
  • Moloco’s estimates of DAU on the Independent App Ecosystem are based on daily counts of unique Android device IDs seen in bid requests, adjusted by a device-to-unique user ratio and extrapolated to account for non-IDFA traffic (including iOS users). Inventory sources include social platforms such as Kakao, Xiaomi, and X.
  • Moloco’s analysis of CPP performance, segmented by advertiser demand and publisher supply, based on more than $1 billion in ad spend.
  • Moloco’s analysis of anonymized and aggregated postback data (matching to user bid request IDFAs where available) for paying user usage trends.
  • Moloco’s analysis of 660 billion daily bid requests for usage trend insights.

All data is anonymized and aggregated. Results by category and market meet robust thresholds: more than 30 apps and over $50,000 in ad spend or revenue.

Source:

Daily active users (DAU), for the purposes of this claim, is defined as the average number of unique consumer devices observed across Moloco's integrated exchange partners and proprietary SDK on Android and iOS devices globally per business day. Based on a Moloco internal estimate of potential daily user reach across an average of five sample business days in March and April 2026. Each device is assigned to a single country to prevent double-counting; tablets are excluded through deterministic classification using exchange signals and device model matching; and country-specific device-to-user calibration factors are applied to translate device counts to estimated unique users.

Source:

Moloco Internal Data Unique ISO 3166-1 countries, territories, or special areas of geographic interest in RTB bid requests received by Moloco Ads, February 1–28, 2026.

Source:

Moloco internal analysis, Jan-Mar 2026. Average number of RTB (real time bid) requests processed by Moloco Ads globally.

Source:

Moloco Internal Data; count of distinct app bundles (iOS and Android cumulative total) where Moloco received at least RTB (real time bid) request in the 90-day period ending April 3, 2026, worldwide. ‘Independent’ refers to apps not operated by Walled Gardens (e.g., Facebook, Instagram, TikTok, Amazon Shopping, YouTube).

Source:

Daily active users (DAU), for the purposes of this claim, is defined as the average number of unique consumer devices observed across Moloco\'s integrated exchange partners and proprietary SDK on Android and iOS devices globally per business day. Based on a Moloco internal estimate of potential daily user reach across an average of five sample business days in March and April 2026. Each device is assigned to a single country to prevent double-counting; tablets are excluded through deterministic classification using exchange signals and device model matching; and country-specific device-to-user calibration factors are applied to translate device counts to estimated unique users.

Source:

Daily active users (DAU), for the purposes of this claim, is defined as the average number of unique consumer devices observed across Molocos integrated exchange partners and proprietary SDK on Android and iOS devices globally per business day. Based on a Moloco internal estimate of potential daily user reach across an average of five sample business days in March and April 2026. Each device is assigned to a single country to prevent double-counting; tablets are excluded through deterministic classification using exchange signals and device model matching; and country-specific device-to-user calibration factors are applied to translate device counts to estimated unique users.

Source:

Daily active users (DAU), for the purposes of this claim, is defined as the average number of unique consumer devices observed across Moloco's integrated exchange partners and proprietary SDK on Android and iOS devices globally per business day. Based on a Moloco internal estimate of potential daily user reach across an average of five sample business days in March and April 2026. Each device is assigned to a single country to prevent double-counting; tablets are excluded through deterministic classification using exchange signals and device model matching; and country-specific device-to-user calibration factors are applied to translate device counts to estimated unique users.

Source:

Moloco Ads internal analysis of SDK publishers only, based on 151 net-new IAA publishers with ≥1,000 pre-period impressions, activated between December 11, 2025 and February 9, 2026. Uplift is measured as the change in Moloco spend on publisher SDK inventory and eCPM (Moloco spend per 1,000 impressions) in the 30 days after SDK activation versus the 30 days before, with median figures based on all qualifying publishers. Results reflect Moloco demand only, not publishers’ total ad revenue across all demand sources.

Source:

Moloco internal analysis, January 2024 to November 2025. Meta-analysis of 22 apps across 8 countries running both re-engagement and user acquisition campaigns on Moloco Ads. Minimum total gross advertising spend of at least $100,000, with each campaign being at least $10,000. RE and UA campaigns shared the same optimization goal and at least one overlapping target action event and campaign timeline. 3.8x times lower CPA means the median cost per action on RE campaigns is 73% lower than the median cost per action on UA campaigns for the sample group.

Source:

Moloco Internal Data; gross advertising spend on Moloco Ads app campaigns, worldwide. Analysis covers the 90-day period ending March 31, 2026 (December 31, 2025 – March 31, 2026). Campaigns classified by optimization goal: CPA (cost-per-action) or ROAS (return-on-ad-spend).

Source:

SensorTower ranking of top mobile gaming apps by 2025 revenue (IAP & subscription), excluding Mainland China. January 1–December 31, 2025.

Source:

Moloco analysis of mobile bid request volume across Food & Drink apps (SensorTower category), United States, April 2025 (local hour-of-day, timezone-adjusted). 6-10pm references 18:00 to 21:59

Source:

Daily active users (DAU), for the purposes of this claim, is defined as the average number of unique consumer devices observed across Moloco\'s integrated exchange partners and proprietary SDK on Android and iOS devices globally per business day. Based on a Moloco internal estimate of potential daily user reach across an average of five sample business days in March and April 2026. Each device is assigned to a single country to prevent double-counting; tablets are excluded through deterministic classification using exchange signals and device model matching; and country-specific device-to-user calibration factors are applied to translate device counts to estimated unique users.

More than 2.8 million apps: count of distinct app bundles (iOS and Android cumulative total) where Moloco received at least one RTB (real-time bid) request in the 90-day period ending April 3, 2026, worldwide. Moloco internal analysis, Jan-Mar 2026. Average number of RTB (real time bid) requests processed by Moloco Ads globally.

Source:

Moloco Internal Data; gross advertising spend on Moloco Ads app campaigns, worldwide. December 31, 2025 – March 31, 2026.

Source:

Sensor Tower ranking of top mobile app publishers by 2025 revenue (IAP & subscription), excluding Mainland China. January 1–December 31, 2025.

Source:

Daily active users (DAU), for the purposes of this claim, is defined as the average number of unique consumer devices observed across Moloco\'s integrated exchange partners and proprietary SDK on Android and iOS devices globally per business day. Based on a Moloco internal estimate of potential daily user reach across an average of five sample business days in March and April 2026. Each device is assigned to a single country to prevent double-counting; tablets are excluded through deterministic classification using exchange signals and device model matching; and country-specific device-to-user calibration factors are applied to translate device counts to estimated unique users.

Source:

Moloco internal data, January 2025 to December 2025.

Source:

Moloco ExpLab platform data, Q4 2025.

Source:

Moloco internal platform data, daily average of events January 2025 to December 2025.

Moloco ExpLab platform data, Q4 2025. Moloco internal data, January 2025 to December 2025.

Moloco internal platform data. Reflects the combined impact of model updates released during 2025, each validated through a controlled A/B experiment before full deployment.

Source:

Moloco Internal Data; average daily ad opportunities received by Moloco Ads, January – March 2026. Figure is an estimate derived from sampled infrastructure data scaled to total volume.

Source:

Daily active users (DAU), for the purposes of this claim, is defined as the average number of unique consumer devices observed across Moloco\'s integrated exchange partners and proprietary SDK on Android and iOS devices globally per business day. Based on Moloco internal estimate of potential daily user reach across an average of five sample business days in March and April 2026. Each device is assigned to a single country to prevent double-counting; tablets are excluded through deterministic classification using exchange signals and device model matching; and country-specific device-to-user calibration factors are applied to translate device counts to estimated unique users. Number of Apps: Moloco Internal Data; count of distinct app bundles (iOS and Android cumulative total) where Moloco received at least one RTB (real time bid) request in the 90-day period ending April 3, 2026, worldwide. ‘Independent’ refers to apps not operated by Walled Gardens (e.g., Facebook, Instagram, TikTok, Amazon Shopping, YouTube).

Moloco internal data; count of distinct ad exchanges through which Moloco Ads DSP actively purchased media, worldwide, Q1 2026 (January–March 2026). Excludes Moloco SDK-based inventory to avoid double-counting.

Source:

Moloco Internal Data; average daily ad opportunities received by Moloco Ads, January – March 2026. Figure is an estimate derived from sampled infrastructure data scaled to total volume.

Source:

Moloco Internal Data; count of distinct app bundles (iOS and Android cumulative total) where Moloco received at least one RTB (real time bid) request in the 90-day period ending April 3, 2026, worldwide. ‘Independent’ refers to apps not operated by Walled Gardens (e.g., Facebook, Instagram, TikTok, Amazon Shopping, YouTube)

Source:

Moloco Internal Data; gross advertising spend on Moloco Ads app campaigns, worldwide. December 31, 2025 – March 31, 2026.

Source:

Moloco internal data; analysis of leading Moloco Sportsbook, Fantasy Sports, and Prediction Market advertisers, Super Bowl LX (February 8, 2026) targeting US iOS users during 2-3 pm PT on 02/08/26. First time-deposit volume and cost per first time-deposit compared to 2025 hourly averages. Moloco-attributed events only.

*Event names are trademarks of their respective owners; references are descriptive and do not imply sponsorship or affiliation.

Source:

Moloco analysis of Sensor Tower U.S. download rankings, Q1 2026. Among the top 20 most-downloaded sportsbook, fantasy sports, and prediction market apps, 14 had at least one active Moloco Ads campaign during the period.

Source:

Daily active users (DAU), for the purposes of this claim, is defined as the average number of unique consumer devices observed across Moloco\'s integrated exchange partners and proprietary SDK on Android and iOS devices globally per business day. Based on a Moloco internal estimate of potential daily user reach across an average of five sample business days in March and April 2026. Each device is assigned to a single country to prevent double-counting; tablets are excluded through deterministic classification using exchange signals and device model matching; and country-specific device-to-user calibration factors are applied to translate device counts to estimated unique users.

Source:

Moloco/Marketing Dive Mobile App Marketing & Advertising Survey, fielded Dec 20, 2024 – Jan 13, 2025. N=200 US mobile app marketers (director+), n=50 Banking/Fintech subset. Not established DSP users are defined as respondents who reported using programmatic media/DSP/ad networks for less than a year, used in the past but not currently, considering but not using, or not planning to use

Source:

Sensor Tower, Consumer Banking App Market and Advertising Trends 2025

Source:

Business of Apps, Cost per Install (CPI) Rates (2025), February 2025

Source:

Moloco analysis of mobile bid request volume across Food & Drink apps (SensorTower category), United States, April 2025 (local hour-of-day, timezone-adjusted). 6-10pm references 18:00 to 21:59

Source:

Daily active users (DAU), for the purposes of this claim, is defined as the average number of unique consumer devices observed across Moloco\'s integrated exchange partners and proprietary SDK on Android and iOS devices globally per business day. Based on a Moloco internal estimate of potential daily user reach across an average of five sample business days in March and April 2026. Each device is assigned to a single country to prevent double-counting; tablets are excluded through deterministic classification using exchange signals and device model matching; and country-specific device-to-user calibration factors are applied to translate device counts to estimated unique users.

More than 2.8 million apps: count of distinct app bundles (iOS and Android cumulative total) where Moloco received at least one RTB (real-time bid) request in the 90-day period ending April 3, 2026, worldwide

Source:

Moloco Internal Data; gross advertising spend on Moloco Ads app campaigns, worldwide. December 31, 2025 – March 31, 2026).

Source:

SensorTower ranking of top mobile app publishers by 2025 revenue (IAP & subscription), excluding Mainland China. January 1–December 31, 2025.

Source:

Daily active users (DAU), for the purposes of this claim, is defined as the average number of unique consumer devices observed across Moloco\'s integrated exchange partners and proprietary SDK on Android and iOS devices globally per business day. Based on a Moloco internal estimate of potential daily user reach across an average of five sample business days in March and April 2026. Each device is assigned to a single country to prevent double-counting; tablets are excluded through deterministic classification using exchange signals and device model matching; and country-specific device-to-user calibration factors are applied to translate device counts to estimated unique users.

Source:

Daily active users (DAU), for the purposes of this claim, is defined as the average number of unique consumer devices observed across Molocos integrated exchange partners and proprietary SDK on Android and iOS devices globally per business day. Based on a Moloco internal estimate of potential daily user reach across an average of five sample business days in March and April 2026. Each device is assigned to a single country to prevent double-counting; tablets are excluded through deterministic classification using exchange signals and device model matching; and country-specific device-to-user calibration factors are applied to translate device counts to estimated unique users.

Source:

Moloco internal data. Validated with customer. Dec 2024 - Jun 2025.

Source:

Based on Moloco's dashboard, approved by ManoMano's Data team, compares Q2 2025 and Q2 2026 data.

Source:

Moloco Internal Data, validated with customer; analysis period: December 2024 - June 2025.

Source

test

Source

Moloco Internal Data Unique ISO 3166-1 countries, territories, or special areas of geographic interest in RTB bid requests received by Moloco Ads, February 1-28, 2026.

Source

Moloco internal data; gross advertising spend on Moloco Ads app campaigns, worldwide, in the 90-day period ending March 31, 2026. Campaigns classified by optimization goal: CPA (cost per action) or ROAS (return on ad spend).

Source

Top 10 advertisers with highest lifetime spend with Moloco as of December 2025.

Source

Sensor Tower ranking of top mobile app publishers by 2025 revenue (IAP & subscription), excluding Mainland China. January 1- December 31, 2025.

Source

Moloco Internal Data; count of distinct app bundles (iOS and Android cumulative total) where Moloco received at least RTB (real time bid) request in the 90-day period ending April 3, 2026, worldwide. �Independent� refers to apps not operated by Walled Gardens (e.g., Facebook, Instagram, TikTok, Amazon Shopping, YouTube)

Source

Moloco internal data; gross advertising spend on Moloco Ads app campaigns by ad format, worldwide, Q4 2025 (October 1, 2025 � December 31, 2025).

Source

Daily active users (DAU), for the purposes of this claim, is defined as the average number of unique consumer devices observed across Moloco\'s integrated exchange partners and proprietary SDK on Android and iOS devices globally per business day. Based on a Moloco internal estimate of potential daily user reach across an average of five sample business days in March and April 2026. Each device is assigned to a single country to prevent double-counting; tablets are excluded through deterministic classification using exchange signals and device model matching; and country-specific device-to-user calibration factors are applied to translate device counts to estimated unique users.

Moloco Internal Data; count of distinct app bundles (iOS and Android cumulative total) where Moloco received at least RTB (real time bid) request in the 90-day period ending April 3, 2026, worldwide. �Independent� refers to apps not operated by Walled Gardens (e.g., Facebook, Instagram, TikTok, Amazon Shopping, YouTube).

Source

Moloco Internal Data; average daily ad opportunities received by Moloco Ads, January - February 2026. Figure is an estimate derived from sampled infrastructure data scaled to total volume.

Source

Business of Apps, App Data Report 2026, February 2026

Source:

Daily active users (DAU), for the purposes of this claim, is defined as the average number of unique consumer devices observed across Moloco\'s integrated exchange partners and proprietary SDK on Android and iOS devices globally per business day. Based on a Moloco internal estimate of potential daily user reach across an average of five sample business days in March and April 2026. Each device is assigned to a single country to prevent double-counting; tablets are excluded through deterministic classification using exchange signals and device model matching; and country-specific device-to-user calibration factors are applied to translate device counts to estimated unique users.


Moloco Internal Data; count of distinct app bundles (iOS and Android cumulative total) where Moloco received at least one RTB (real time bid) request in the 90-day period ending April 3, 2026, worldwide. "Independent" refers to apps not operated by Walled Gardens (e.g., Facebook, Instagram, TikTok, Amazon Shopping, YouTube).

Customer provided data; analysis period: Q4 2024.

Source:

Moloco internal platform data. Measured from controlled A/B experiments in Moloco\'s experimentation platform across 65 model updates that ramped to at least 80% of traffic between January 1 and December 31, 2025.

Source:

Daily active users (DAU), for the purposes of this claim, is defined as the average number of unique consumer devices observed across Moloco\'s integrated exchange partners and proprietary SDK on Android and iOS devices globally per business day. Based on a Moloco internal estimate of potential daily user reach across an average of five sample business days in March and April 2026. Each device is assigned to a single country to prevent double-counting; tablets are excluded through deterministic classification using exchange signals and device model matching; and country-specific device-to-user calibration factors are applied to translate device counts to estimated unique users.

Source:

Moloco Internal Data; average daily ad opportunities received by Moloco Ads, January – February 2026. Figure is an estimate derived from sampled infrastructure data scaled to total volume.

Source:

Moloco Internal Data; Unique ISO 3166-1 countries, territories, or special areas of geographic interest, with at least one delivered impression via Moloco Ads (App, Web, CTV) February 1–28, 2026.

Source:

Sensor Tower ranking of top mobile app publishers by 2025 revenue (IAP & subscription), excluding Mainland China. January 1–December 31, 2025.

Source:

Moloco internal data; gross advertising spend on Moloco Ads app campaigns by ad format, worldwide, Q4 2025 (October 1, 2025 – December 31, 2025).

Source:

Daily active users (DAU), for the purposes of this claim, is defined as the average number of unique consumer devices observed across Moloco\'s integrated exchange partners and proprietary SDK on Android and iOS devices globally per business day. Based on a Moloco internal estimate of potential daily user reach across an average of five sample business days in March and April 2026. Each device is assigned to a single country to prevent double-counting; tablets are excluded through deterministic classification using exchange signals and device model matching; and country-specific device-to-user calibration factors are applied to translate device counts to estimated unique users. </p> <br> <p>More than 2.8 million apps: count of distinct app bundles (iOS and Android cumulative total) where Moloco received at least one RTB (real-time bid) request in the 90-day period ending April 3, 2026, worldwide

Source:

Moloco internal data; gross advertising spend on Moloco Ads app campaigns by ad format, worldwide, Q4 2025 (October 1, 2025 – December 31, 2025).

Source:

Moloco internal Data; gross advertising spend on Moloco Ads app campaigns, worldwide. December 31, 2025 – March 31, 2026.

Source:

Daily active users (DAU), for the purposes of this claim, is defined as the average number of unique consumer devices observed across Moloco`s integrated exchange partners and proprietary SDK on Android and iOS devices globally per business day. Based on a Moloco internal estimate of potential daily user reach across an average of five sample business days in March and April 2026. Each device is assigned to a single country to prevent double-counting; tablets are excluded through deterministic classification using exchange signals and device model matching; and country-specific device-to-user calibration factors are applied to translate device counts to estimated unique users.

Source:

Moloco Internal Data, validated with customer; analysis period: December 2024 - June 2025.

Source:

Customer provided data; analysis period: Q4 2024.

Source:

Moloco internal data. Analysis uses data through March 31, 2026 and is based on sponsored-ads MCM retailers that commercialized on or after April 1, 2022. A2G (ad spend as a percent of GMV) is measured in consecutive 30-day windows from each retailer's commercial launch, with each 30-day window treated as one month (e.g., the first year covers the first 12 windows). A retailer reached a given A2G level when its A2G averaged that level or higher over a complete 30-day window. Results reflect a mixture of business models and verticals.

Source:

Customer provided data; analysis period: Q4 2024

Source:

Moloco internal data for average ROAS for sponsored product campaigns in Q1 2026. Calculated as the sum of total attributed revenue across MCM divided by the sum of ad spend for retailers active over the whole quarter. Retailers are considered active if they have non-zero ad spend throughout the quarter. ROAS is calculated using each retailer's own attribution configuration, including direct and indirect (halo) attributions where reported. Attribution logic, including windows and types, varies across retailers. Results reflect a mix of business models and verticals.

Source:

Moloco internal data. Analysis comparing first 4 weeks vs. latest 4 weeks of daily GAS and A2G across MCM customers, as of Mar 31, 2026.

Source:

Moloco Internal Data; average daily ad opportunities received by Moloco Ads, January - February 2026. Figure is an estimate derived from sampled infrastructure data scaled to total volume.

Source:

Moloco Internal Data; Unique ISO 3166-1 countries, territories, or special areas of geographic interest, with at least one delivered impression via Moloco Ads (App, Web, CTV) February 1-28, 2026.

Source:

Sensor Tower ranking of top mobile app publishers by 2025 revenue (IAP & subscription), excluding Mainland China. January 1-December 31, 2025.

Source:

Moloco internal data; gross advertising spend on Moloco Ads app campaigns by ad format, worldwide, Q4 2025 (October 1, 2025 - December 31, 2025).

Source:

Daily active users (DAU), for the purposes of this claim, is defined as the average number of unique consumer devices observed across Moloco's integrated exchange partners and proprietary SDK on Android and iOS devices globally per business day. Based on a Moloco internal estimate of potential daily user reach across an average of five sample business days in March and April 2026. Each device is assigned to a single country to prevent double-counting; tablets are excluded through deterministic classification using exchange signals and device model matching; and country-specific device-to-user calibration factors are applied to translate device counts to estimated unique users.


More than 2.8 million apps: count of distinct app bundles (iOS and Android cumulative total) where Moloco received at least one RTB (real-time bid) request in the 90-day period ending April 3, 2026, worldwide

Source:

Moloco internal data; gross advertising spend on Moloco Ads app campaigns by ad format, worldwide, Q4 2025 (October 1, 2025 - December 31, 2025).

Source:

Moloco internal Data; gross advertising spend on Moloco Ads app campaigns, worldwide. December 31, 2025 - March 31, 2026.

Source:

Moloco internal data. Analysis of machine learning (ML) model predictions executed in real time while serving ad requests during the week of June 1 to June 7, 2026. ML prediction counts are derived from auction records rather than measured directly: each ad request invokes one user-context model inference, and each ad evaluated in an auction invokes a fixed number of scoring inferences determined by its ad format. Sponsored Product ads invoke two scoring inferences per ad evaluated, one click-through-rate (CTR) and one conversion-rate (CVR) prediction; all other ad formats are counted with one inference per ad candidate, the most conservative estimate. Only inferences executed in real time at request serving are counted; computations performed in advance of ad requests are excluded. Figures are based on sampled internal auction logs (10% sample, scaled accordingly) and averaged to a daily figure.

Source:

Customer provided data; analysis period: Q4 2024.

Source:

Moloco internal data, as of April 2026. A2G (advertising spend as a percentage of gross merchandise value, "GMV") is measured as total ad spend / total GMV during weeks 3-6 following each customer's commercial launch on Moloco MCM (their first billing date), excluding the first two weeks to remove soft-launch ramp. Sample: 24 MCM customers, measured at the contractual-customer level, that had completed six weeks of activity by April 2026. The substantial majority began below 1% initial A2G.

Source:

Source: Daily active users (DAU), for the purposes of this claim, is defined as the average number of unique consumer devices observed across Molocos integrated exchange partners and proprietary SDK on Android and iOS devices globally per business day. Based on a Moloco internal estimate of potential daily user reach across an average of five sample business days in March and April 2026. Each device is assigned to a single country to prevent double-counting; tablets are excluded through deterministic classification using exchange signals and device model matching; and country-specific device-to-user calibration factors are applied to translate device counts to estimated unique users.


Moloco Internal Data; count of distinct app bundles (iOS and Android cumulative total) where Moloco received at least one RTB (real time bid) request in the 90-day period ending April 3, 2026, worldwide. �Independent� refers to apps not operated by Walled Gardens (e.g., Facebook, Instagram, TikTok, Amazon Shopping, YouTube).

Source:

Moloco internal analysis, May to June 2025. Based on a retention analysis of over 10 million non-gaming app users across 624 consumer apps on Moloco Ads (iOS and Android, UA campaigns only). Rolling day-7 retention, defined as any recorded app activity on days 1 through 7 after install, was measured for users who installed between May 1 and June 23, 2025. The median rolling day-7 retention rate across all consumer apps was 26%, meaning 74% of non-gaming users had no recorded app activity in the 7 days following the 24 hours after install period (D0.

Source:

Source: AppsFlyer, App Uninstall Report 2025, Study of Android 2.2k apps covering 1.3bn installs (November 2024).

Source:

Moloco internal analysis, May to June 2025. Based on a retention analysis of more than 10 million gaming app users across 437 gaming apps on Moloco Ads (iOS and Android, UA campaigns only). Rolling day-7 retention, defined as any recorded app activity on days 1 through 7 after install, was measured for users who installed between May 1 and June 23, 2025. The median rolling day-7 retention rate across all gaming apps was 42%, meaning 58% of gaming users had no recorded app activity in the 7 days following the 24 hours after install period (D0).

Source:

Moloco Internal Data; count of distinct app bundles (iOS and Android cumulative total) where Moloco received at least RTB (real time bid) request in the 90-day period ending April 3, 2026, worldwide. 'Independent' refers to apps not operated by Walled Gardens (e.g., Facebook, Instagram, TikTok, Amazon Shopping, YouTube).

Source:

Moloco internal analysis, January 2024 to November 2025. Meta-analysis of 22 apps across 8 countries running both re-engagement and user acquisition campaigns on Moloco Ads. Minimum total gross advertising spend of at least $100,000, with each campaign being at least $10,000. RE and UA campaigns shared the same optimization goal and at least one overlapping target action event and campaign timeline. 3.8x times lower CPA means the median cost per action on RE campaigns is 73% lower than the median cost per action on UA campaigns for the sample group.

Source:

Moloco internal analysis, January 2024 to November 2025. Meta-analysis of 18 apps across 8 countries running both re-engagement and user acquisition campaigns on Moloco Ads. Minimum total gross advertising spend of at least $100,000, with each campaign being at least $10,000. RE and UA campaigns shared the same optimization goal and at least one overlapping target action event and campaign timeline. 5.6x higher performance reflects that median ROAS for RE campaigns is 5.6 times higher than the median of ROAS for UA campaigns in the sample.

Source:

Moloco Internal Data, validated with customer; analysis period: December 2024 - June 2025.

Source:

Moloco Internal Data; Unique ISO 3166-1 countries, territories, or special areas of geographic interest, with at least one delivered impression via Moloco Ads (App, Web, CTV) February 1–28, 2026.

Source:

Sensor Tower ranking of top mobile app publishers by 2025 revenue (IAP & subscription), excluding Mainland China. January 1–December 31, 2025.

Source:

Daily active users (DAU), for the purposes of this claim, is defined as the average number of unique consumer devices observed across Moloco\'s integrated exchange partners and proprietary SDK on Android and iOS devices globally per business day. Based on a Moloco internal estimate of potential daily user reach across an average of five sample business days in March and April 2026. Each device is assigned to a single country to prevent double-counting; tablets are excluded through deterministic classification using exchange signals and device model matching; and country-specific device-to-user calibration factors are applied to translate device counts to estimated unique users.

Source:

Moloco internal data; gross advertising spend on Moloco Ads app campaigns by ad format, worldwide, Q4 2025 (October 1, 2025 – December 31, 2025).

Source:

Moloco internal data for average ROAS for sponsored product campaigns in Q1 2026. Calculated as the sum of total attributed revenue across MCM divided by the sum of ad spend for retailers active over the whole quarter. Retailers are considered active if they have non-zero ad spend throughout the quarter. ROAS is calculated using each retailer\'s own attribution configuration, including direct and indirect (halo) attributions where reported. Attribution logic, including windows and types, varies across retailers. Results reflect a mix of business models and verticals.

Source:

Moloco internal data. Publisher count represents distinct publishers with active SDK monetization revenue, comparing January 1, 2025 to December 31, 2025

Source:

AppGoblin App SDK Report 2025, January 2026. Ranking based on net change in new app integrations among ad networks, comparing H1 vs H2 2025 across 52,287 apps