AI가 바꾸는
리테일의 고객 접점

Launching a new mobile title has never been harder. But for studios who get it right, it’s never been more rewarding.
190,000 new games were released in 2025, but only 2,500 had more than 500k downloads in their first year.1 Organic growth has become increasingly difficult, and for the first time paid media is driving the majority of installs for the typical new launch.2 On paper, that's a tough market. But even as fewer titles break through today compared to a few years ago, new launches' overall share of gaming In-App Purchase (IAP) revenue has held steady.3
That's because the new titles that do break through are winning bigger:

New releases are making money faster:
New releases are monetizing every user better:
Sources
¹ Moloco analysis of SensorTower data, 2021-2025. Global number of downloads in their respective first 365 days of release, as of July 28th 2026. Games released in Q4 2025 may not yet have completed a full 365-day measurement window as of the data observation date.
² Moloco analysis of SensorTower data, top 10,000 newly released mobile games by global downloads per release year. Median paid share of installs has reached 52% for new launches in 2025 (from 27% in 2022).
³ Moloco analysis of SensorTower data, 2021-2025, Global IAP & Subscription Revenue, Excluding Mainland China. New launches from 2023 and 2024 account for approximately the same amount of IAP gaming revenue in 2025 (19%) as 2021 and 2022 launches did in 2023 (17%).
⁴ Moloco analysis of SensorTower data, 2022-2025. Global IAP revenue. H1 releases evaluated in each year to reduce sampling bias.
⁵ Moloco analysis of SensorTower data, 2021-2025. Top 1,000 newly released mobile games by US revenue within the first 180 days from launch.
글로벌 마케팅 리더들은 이미 AI가 고객 경험에 가져올 거대한 변화를 체감하고 있습니다.
BCG와 몰로코가 전 세계 15개 산업군, 283명의 마케팅 리더를 대상으로 진행한 설문 결과, 무려 67%가 AI가 고객의 쇼핑 경험을 근본적으로 뒤바꿀 것이라고 예상했습니다.
하지만 흥미로운 점이 있습니다. 업계별로 이 변화에 대한 준비 수준을 조사한 결과, 리테일 산업은 모든 산업 중에서 가장 낮은 수준의 위기 인식을 보이고 있습니다.
소비자들은 이미 AI를 활용해 상품을 탐색하고, 옵션을 비교하며, 구매 결정을 내리고 있는 반면, 많은 리테일 기업들은 여전히 검색, 광고, 앱, 웹사이트 중심의 기존 고객 유입 구조를 전제로 전략을 수립하고 있습니다.


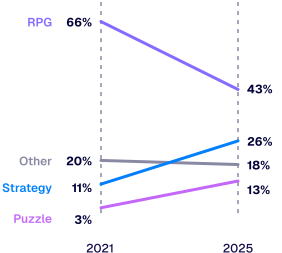
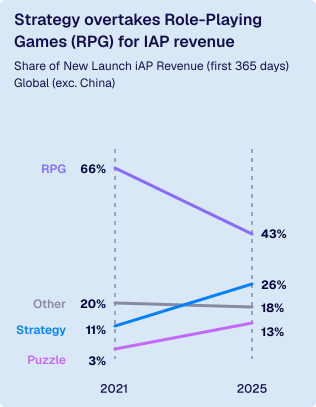
Strategy & Casual have gained ground on RPG for IAP revenue
Share of new launch IAP revenue for the first 365 days, global⁶
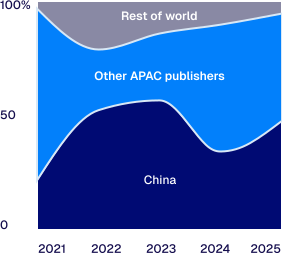
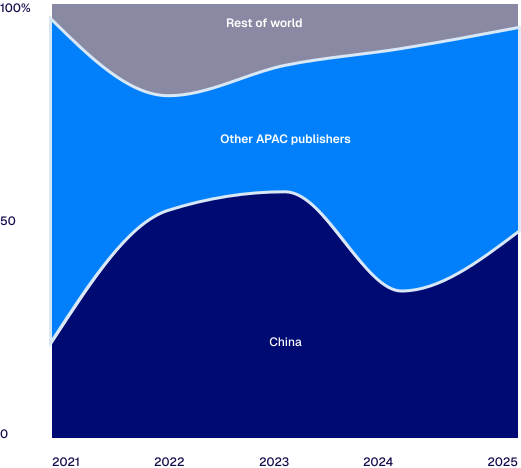
Asian publishers capture the vast majority of global IAP revenue
IAP revenue for top 100 new launches by year⁷
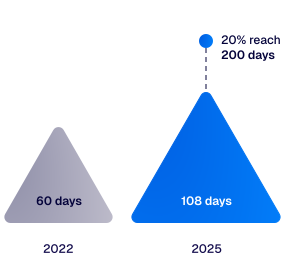
Median soft launch duration has nearly doubled
Moloco-supported launches, 2022-2025⁸
Many publishers treat a new launch as a concentrated sprint where the outcome gets decided in the first few months. New analysis from Moloco shows why the publishers who break through treat launches as a year-long operation – testing, learning, and fine-tuning all along the way. The insights show that long-view matters more than publishers may expect: Per-payer value more than doubles over the first year. Whale dominance doesn't peak until month eight. And more than a third of a title's top spenders haven't even arrived by month six.
What separates the launches that break through from the ones that stall? We analyzed 55 new mobile game launches through their entire first year. These launches represent more than $1.5 billion in IAP revenue across 20 million+ payers.
55 new mobile game launches that Moloco supported between January 2024 and September 2025
Titles active and scaling across their full first year, including several of the top-grossing and most-downloaded new launches of 2024 and 2025
Spanning social casino, casual, and mid-core genres; real-money gaming excluded
U.S. users, with publishers and studios from across the globe
In-app purchase behavior tracked through each title's first 12 months, covering both Moloco-attributed and unattributed revenue, with data observed through June 2026
Unless otherwise stated a reference to a whale user represents a user within the top 5% of payers for a given app, most commonly cited across the 12 month period from launch or within a D7 or D30 cohort
Benchmarks weight every title equally unless otherwise noted (so trends reflect a typical launch rather than the largest titles)
Here's how the first year plays out across monetization, acquisition, and creative.

Chapter 1: monetization
The monetization picture takes time to develop
The first thing we looked at was monetization, which is often the make-or-break factor for a new launch. Instead of looking at the data by genre, we grouped the titles by how they make money:
Whale-Driven: revenue primarily comes from a small group of high spenders. These titles sit above 70% whale concentration, with ARPPU typically above $100.
Volume-Driven: revenue primarily comes from many payers purchasing repeatedly. Whale concentration is in the 40% to 65% range, with ARPPU between $35 and $165.
Ad-Driven: revenue primarily comes from advertising, with lower IAP frequency and size. ARPPU is under $20.
Monetization archetypes, classified by Moloco
Whale concentration (top 5% of payers by value over the first 12 months of a launch) vs. ARPPU (Average Revenue per Paying User)
Our monetization deep dive focuses on IAP revenue for Volume-Driven and Whale-Driven titles. What we found is that the first month reveals surprisingly little about where a title ends up.

Payers grow more valuable as monetization matures
When we look at IAP titles, per-payer value isn’t static at launch. For Whale-Driven titles, ARPPU is 250% higher at the end of the first year than it is in the first month. And ARPPU for Volume-Driven titles ends the year up 25%.
Most of that value growth comes from purchase frequency, as payers continue to engage with the game all year. Whale-Driven payers also increase their transaction amounts as the year goes on.
Most titles increase user value through the first year…
ARPPU by months since launch, indexed to month 1
…driven by growing frequency and bigger transactions for Whale-Driven payers, and by frequency alone for Volume-Driven payers
Transaction frequency per payer, with transaction value indexed to month 1 post-release
The implication

What monetization looks like at month one is not a reliable signal for a title's long-term revenue potential. Players who will drive the most value are still building their habits, and publishers have a long runway to shift their monetization strategies.
Whales drive a much higher percentage of revenue as the year goes on
At launch, a title's revenue is fairly broadly distributed. Plenty of players make a purchase, and the eventual top spenders are just one contributor among many. Some payers buy once, or only within a single month, and then stop, while others keep purchasing all year. As the year goes on, the whales make up a a greater share of overall revenue. For Whale-Driven titles, whales account for the overwhelming majority of monthly revenue by the second half of the launch year.
Volume-Driven titles follow a flatter version of the same arc. These titles’ revenue rests on a wide middle range of players who return to purchase across several months, so the whales never dominate to the same degree.
By month 10, whales drive 81% of Whale-Driven revenue and 54% of Volume-Driven
Share of IAP revenue from the top 5% of payers, by months since launch
Most payers spend for a single month; repeat purchases drive most of the revenue
Share of payers vs. share of first-year revenue
Color key

The implication
Early spend will look more distributed than where it ends up. Whales take time to reveal themselves, and the titles that let this audience develop are the ones that come out ahead. The payers who lapse along the way aren't lost, either. They've shown purchase intent and what kind of offer moves them, which makes them a natural re-engagement audience later in the launch year.
Whales arrive all year long
Whales don't cluster at launch, or at any other particular point of the launch year. Across both monetization models, a title's eventual top spenders make their first purchase in a steady stream across the entire launch year. Case in point: only 15% of Whale-Driven titles' eventual top spenders appear in the first month. The whales who will carry a title's revenue are still installing, and spending, in month three, month six, month ten.
Most of a title's whales aren’t there at launch
Share of eventual whales by acquisition window

The implication
If most of a title's whales arrive after the launch month, a UA program that front-loads spend and tapers off isn’t aligned with how the player base actually develops. Sustained, year-long acquisition is what gives a title the chance to catch high-value users over time.
Whales’ early behavior often predicts later value
As we’ve seen, whales arrive throughout the launch year and take months to dominate revenue. That raises an obvious question: how do you evaluate acquisition spend when the payoff is this delayed? The data shows that a player's early purchasing behavior reveals them quickly. Most eventual whales are already among a title's top spenders within a month of their first purchase, even though the large majority of their value is still to come.
Days after install, eventual whales have spent a fraction of what they will over the year…
…but within days of first purchase, many eventual whales are already in top 5% of payers
The implication
For UA, this means the evaluation window shouldn't start at install. It’s about spotting high-value players early from their purchase behavior, and bidding to what they will be worth, not what they’ve spent so far. That is how the strongest launches acquire, which is where we turn next.


Chapter 2: acquisition
Breakout titles bid for value from day one – and sustain it all year
The monetization findings raise the stakes for UA: the players who matter most arrive all year and take months to show their value. The launches built around that reality are the cohort's clear winners. We call these seven titles breakouts, each among the top-grossing Moloco-supported new launches of its release year, and their acquisition differs from the rest in two ways.
First, they arrive at launch ready to bid for value. Breakout titles use soft launch to establish retention benchmarks and realistic ROAS targets, so that by general release their campaigns are optimized to predicted revenue. In launch month, 94% of breakout titles' UA spend runs on ROAS objectives (vs. CPI/CPA), compared to 65% for the rest of the cohort. The rest do get there eventually, but they spend their opening months of general release learning what the breakout titles learned during the soft launch.
Soft launch is where the real work happens, not a formality. We run small tests first, so by general release we're working from real ROAS targets, not guesses. That discipline is what lets us scale with confidence across our UA campaigns.
Huyen Dang
UA Manager

Second, they don't let up. Breakout titles hold their spend through months 6 to 12, the stretch when the rest of the cohort pulls back, and as the monetization shows, the stretch when a third of a title's eventual whales have yet to make their first purchase. Breakout titles accept softer D7 and D30 ROAS as they scale because they’re measuring success on predicted lifetime value rather than early payback.
Breakout titles start on ROAS at launch, spend heavier late, and accept softer early return
Monthly UA spend share, US
Select timeframe
Color key

The implication
Bid to predicted value from day one of general release, and keep spending while the signals hold. Some titles won't earn that sustained investment and cutting losses is the right decision. Just make the call on the right evidence: Early revenue often lags behind the payers who will drive it, so D7 payback alone can hinder titles that were working. UA programs that taper spend too early may miss the high-value users who are still arriving.


Chapter 3: creative
Breakout titles build and evolve their creative all year
Creative strategy is one of the clearest dividing lines between breakout titles and the rest. As AI-powered advertising systems get more efficient at testing a wide range of creatives, and generative AI lowers production costs, publishers can experiment more than they used to. And breakout titles do: They experiment with more creatives, keep producing through the year, and continuously diversify their format mix. The longer the launch runs, the more time the AI system has to learn, and the wider the gap between breakout titles and the rest grows.
Breakout titles supply more creative, and more of it earns spend
Breakout titles on average used 93 distinct creatives, compared to 37 for the rest. Moloco's AI system then identified the best-performing creatives and automatically shifted budget toward them. For breakout titles, this larger creative base spread the budget more evenly: the top spending creative accounted for just 15% of total spend, versus 31% for other titles.
Breakout titles’ budget is spread across more assets
Share of spend earned by a titles’ top creatives
3X as many videos earn spend for breakout titles
Distinct creative count with spend, by format
The implication
Every campaign has to make sense of a nearly unlimited number of combinations: different users, seen in different moments, across different apps. Breakout titles focus on creating a range of creative assets to allow Moloco’s AI to match the right asset to the right moment.
Vietnam-based publisher Bravestars puts this into practice, running a wide range of creatives across banner, video, and playable formats. Playables proved especially effective, driving 13.4x higher install volume and 27% higher D7 ROAS than static images.
Vietnam-based publisher Bravestars puts this into practice, running a wide range of creatives across banner, video, and playable formats. Playables proved especially effective, driving 13.4x higher install volume and 27% higher D7 ROAS than static images.


Breakout titles keep shipping new creative all year
For most titles, creative production peaks at launch and tapers off, yet launch-day assets still draw meaningful spend in the back half of the year. Breakout titles, on the other hand, accelerate their production as the year goes on. Only about a tenth of their creatives ship in the opening weeks of the launch.
47% of breakout titles' creatives ship in months 7-11, versus 27% for the rest
Share of a titles’ creatives, by when they were first introduced
The implication
Treat launch creative as a starting point for gathering signal and performance data, and budget for creative refreshes throughout the year. Seasonal- and event-based moments can be particularly strong occasions for creative refreshes.
Breakout titles shift spend into playables and longer video
All launches in our analysis start video-heavy, and for good reason: video is the discovery format, and playables are more expensive and depend on gameplay that may still be evolving early in a launch. As time goes on, however, breakout titles add playables at a far higher rate than the rest, and the gap widens through the year. The same pattern shows up for video formats as well. Breakouts put real spend into 90-second-plus lengths, a duration the rest rarely touch.
Breakout titles run playables at twice the rate of the rest…
Format mix as % of spend
…and move into longer-form videos
Share of video that earned budget by video ad length
Color key

The implication
Playables and a wider range of video lengths reach placements and engage players that a narrower creative set can't. Titles that hold the same format mix all year limit both the inventory they can bid on and the signal that helps AI find the right players for every ad.
Why the first year matters more than the first month
The new launch market has never been more competitive, but the opportunity is there for those who play it right. Across the first year, monetization keeps developing: payers grow more valuable, whales take time to emerge, and many of the highest-value users arrive months after launch. At the same time, the breakout titles in our analysis show what it takes to operate against that reality: bidding for predicted value early, sustaining UA spend throughout the year, and continuing to expand creative well beyond launch.
When it comes down to it, the launch month offers some signal about whether a title is working and how publishers should adjust. But it can’t tell the whole story. It often misses the value that develops later: payers who spend more over time, whales who haven’t arrived yet, and creative or UA learnings that only compound after months of iteration.